Journal-quality figures
From $40 / figure
- Bar, line, scatter, heatmap, survival curves
- Error bars, significance markers, annotations
- Colorblind-safe palette and consistent typography
- 300 dpi PNG/TIFF + vector PDF/SVG
For life-science labs
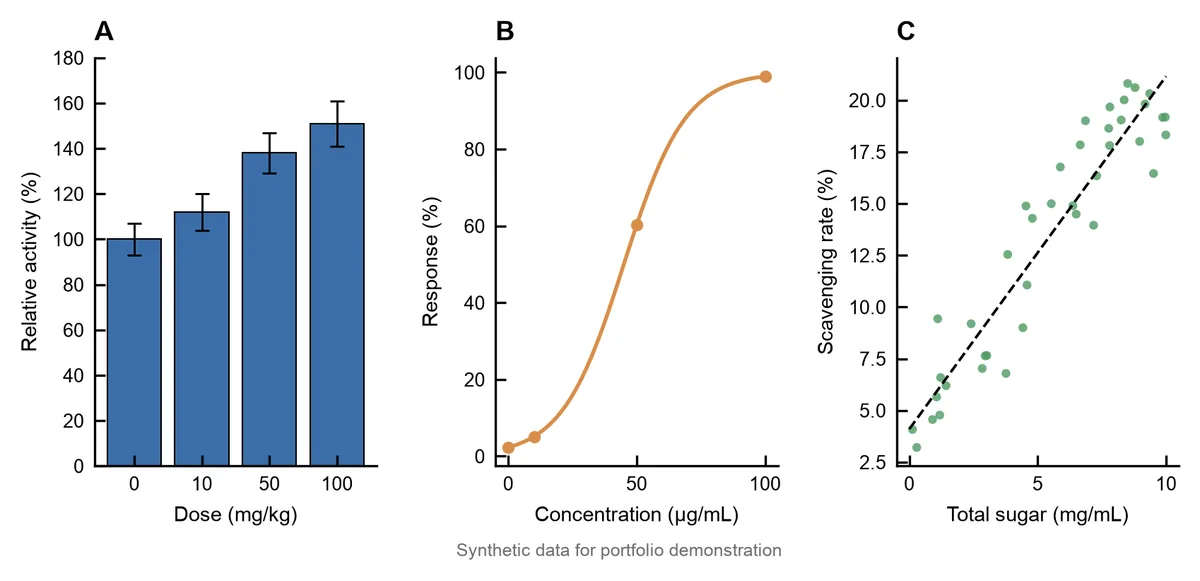
I turn raw Excel sheets and half-finished plots into journal-standard figures — clean layout, error bars, significance markers, colorblind-safe palettes, and the R script behind every panel.
Sample figures built with synthetic data. Your data stays confidential and is never published.
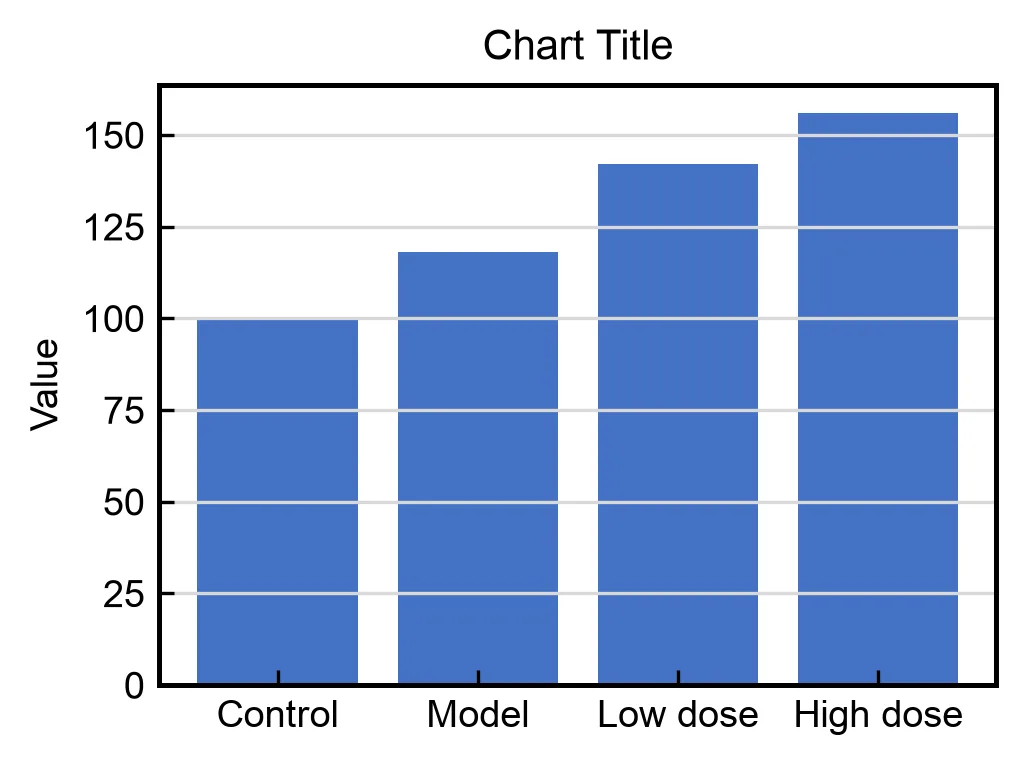
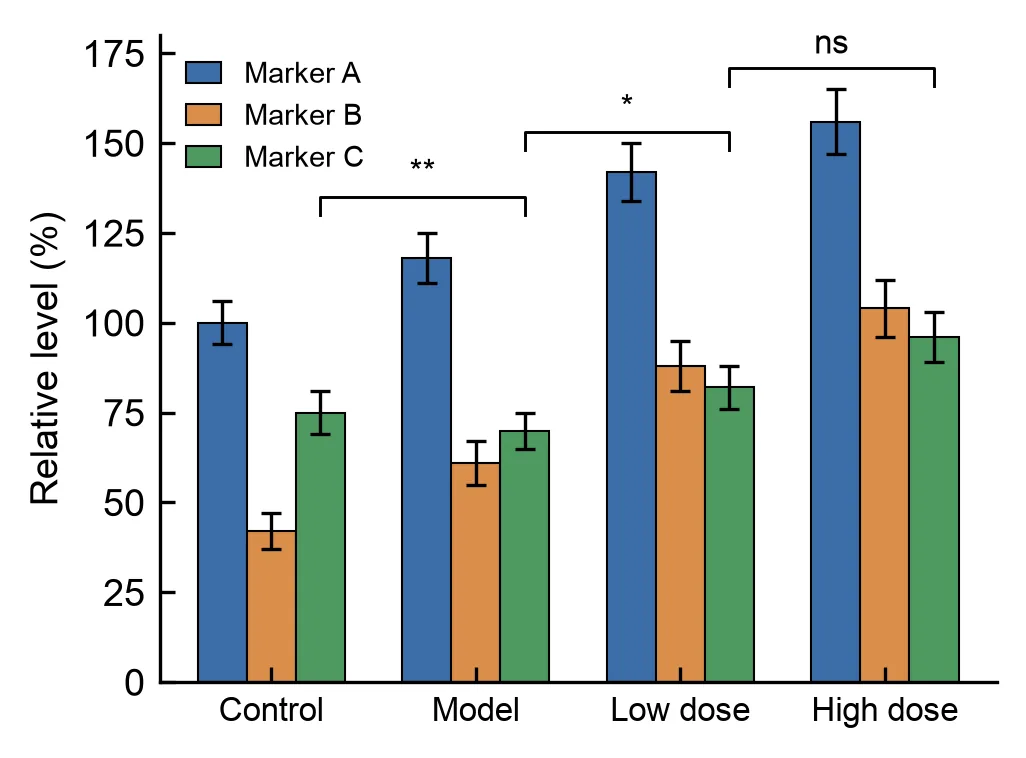
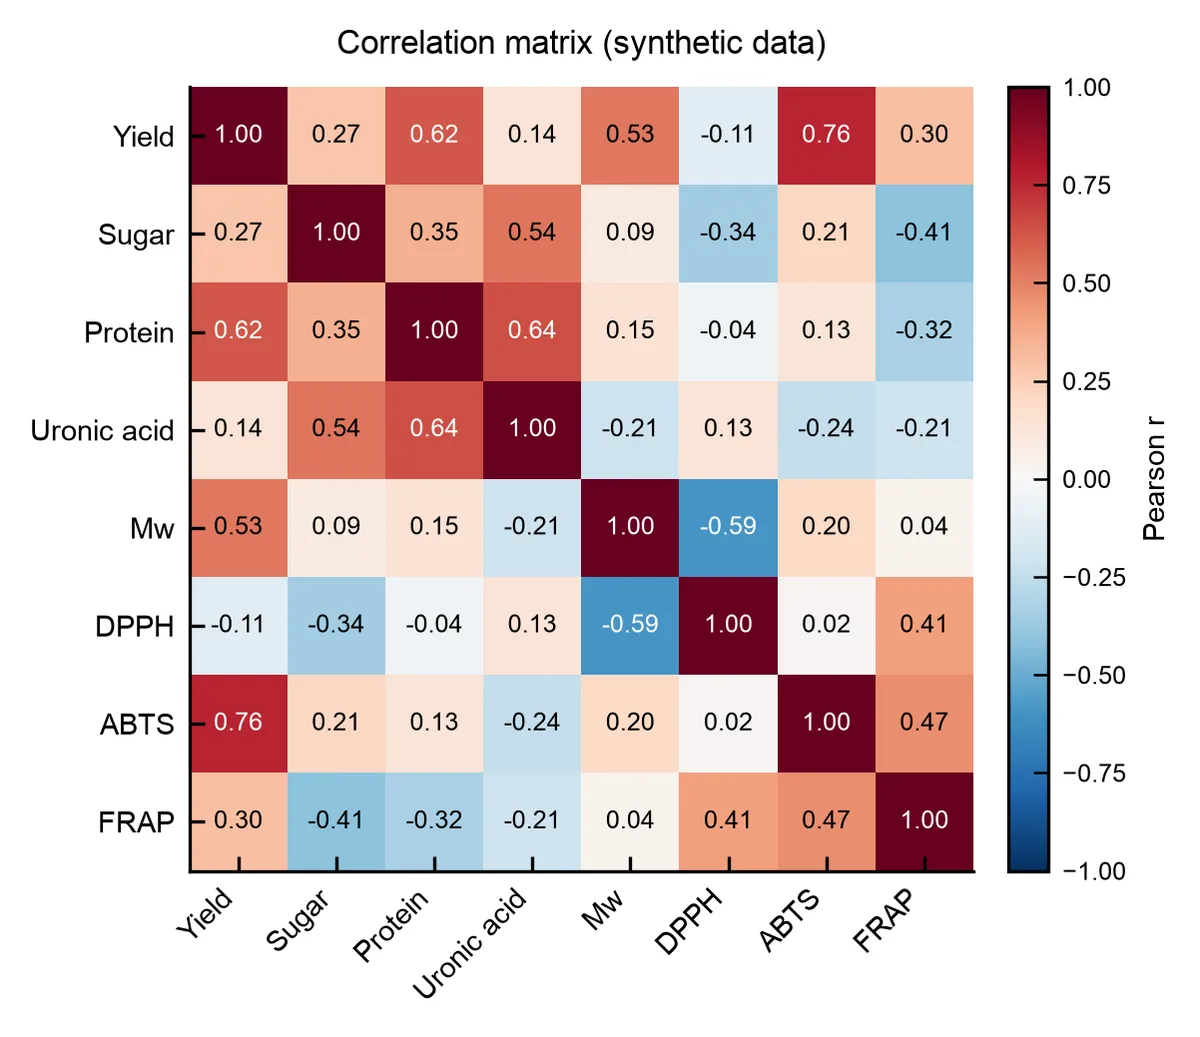
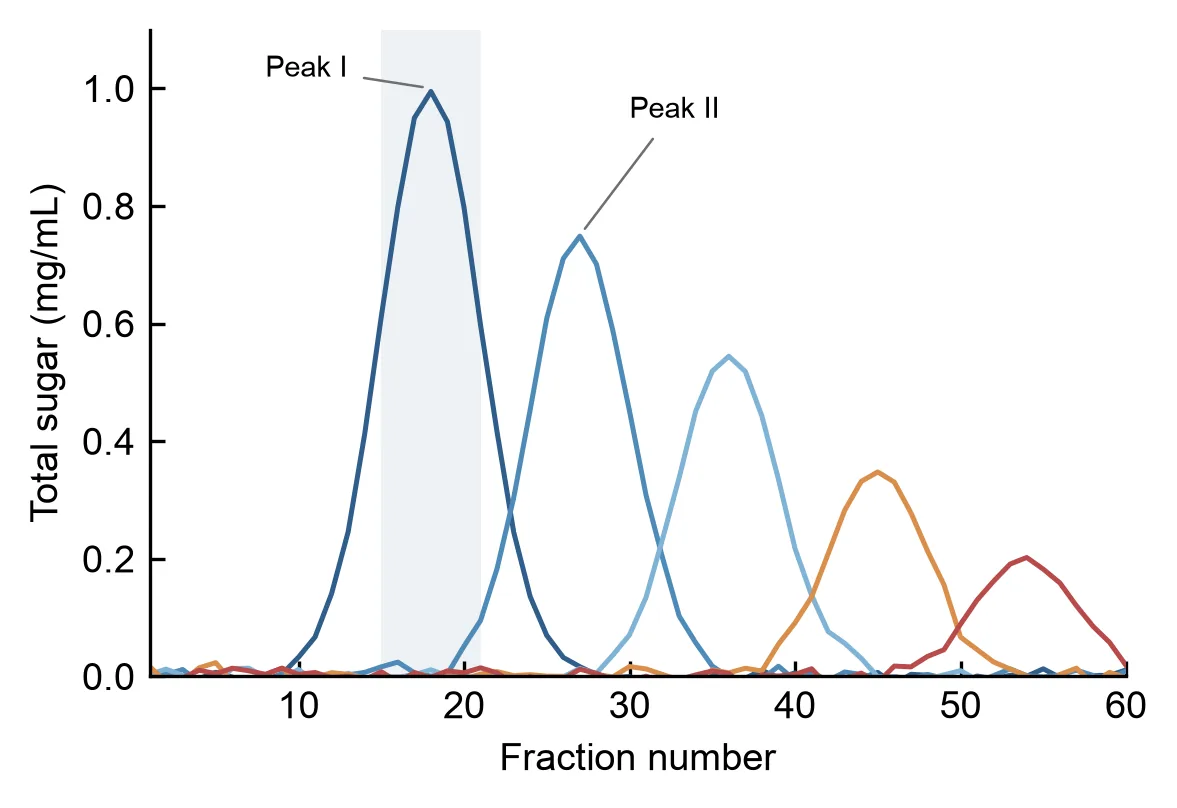
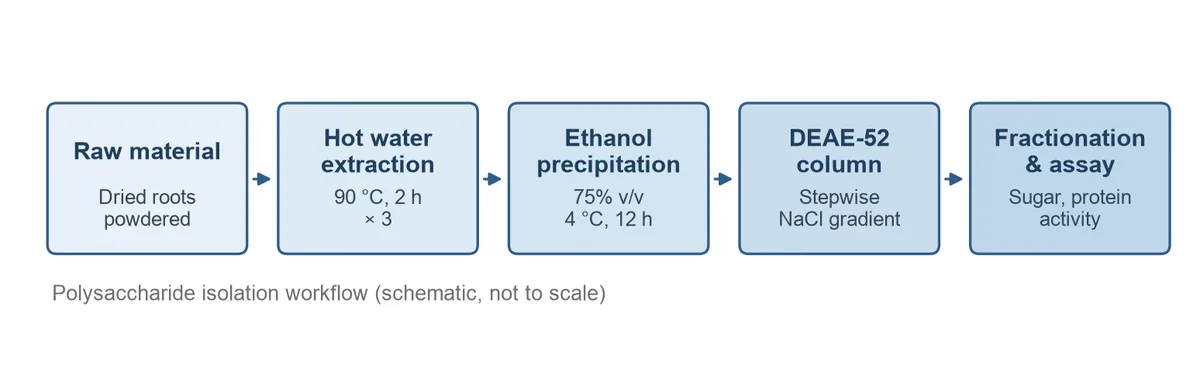
Fixed scope, fixed price. Send your files and journal guidelines for an exact quote.
From $40 / figure
From $80 / dataset
From $100 / piece
No calls required. Everything can be handled in writing.
Raw data, a rough sketch, and the target journal's figure guidelines.
I confirm feasibility, price and delivery date before you order.
A complete draft within 48 hours, with the R script attached.
Two revision rounds, then final 300 dpi and vector files.
300 dpi PNG and TIFF for submission, vector PDF/SVG for editing, and the R script used to generate the figure.
No. I provide figures, statistical analysis and visualization only. I do not write manuscripts, fake data, or handle journal submission.
Yes. An NDA can be signed on request. Working files are deleted 30 days after delivery unless you ask me to keep them.
Yes. Raw Excel exports are fine. Cleaning, reshaping and outlier checks are included in the analysis package.
Yes. Send one or two published figures from the journal and I will match fonts, sizing, line weights and labeling conventions.
Send a screenshot and the target journal. You will get a fixed quote and a delivery date, usually within one working day.